Sunday 22 February 2015

Setting Up ODBC Connection for Teradata using Informatica at Linux

Once you set the ODBC Variables and Paths at Linux Machine and testing is done.. you need to restart the informatica service 

TDExpress15.00.01_Sles10:~ #
TDExpress15.00.01_Sles10:~ # cd /var/opt/teradata/informatica/server/tomcat
TDExpress15.00.01_Sles10:/var/opt/teradata/informatica/server/tomcat # cd bin/
TDExpress15.00.01_Sles10:/var/opt/teradata/informatica/server/tomcat/bin # ls
infaservice.sh
TDExpress15.00.01_Sles10:/var/opt/teradata/informatica/server/tomcat/bin # ./infaservice.sh shutdown
Stopping Informatica services on node 'node01_tdgogate'
TDExpress15.00.01_Sles10:/var/opt/teradata/informatica/server/tomcat/bin # ./infaservice.sh startup
Starting Informatica services on node 'node01_tdgogate'
Using CURRENT_DIR:     /var/opt/teradata/informatica/tomcat/bin
Using INFA_HOME:       /var/opt/teradata/informatica

TDExpress15.00.01_Sles10:/var/opt/teradata/informatica/server/tomcat/bin #


Part - 1

TDExpress15.00.01_Sles10:/var/opt/teradata/informatica/tools/debugtools/ssgodbc/linux64 # ls
ssgodbc.linux64
TDExpress15.00.01_Sles10:/var/opt/teradata/informatica/tools/debugtools/ssgodbc/linux64 # ./ssgodbc.linux64
Usage: ssgodbc -d dsn -u username -p password [-t user] [-v] [-g]
-d Data Source Name
-u odbc username
-p odbc password
-v verbose output
-c column description only
-g get array size only
-t time SQLTablesW for user
TDExpress15.00.01_Sles10:/var/opt/teradata/informatica/tools/debugtools/ssgodbc/linux64 # ./ssgodbc.linux64 -d DBC -u dbc -p dbc -v
Error for thread 0
{error} STATE=IM003, CODE=46909632806912, MSG=[DataDirect][ODBC lib] Specified driver could not be loaded
TDExpress15.00.01_Sles10:/var/opt/teradata/informatica/tools/debugtools/ssgodbc/linux64 # vi /var/opt/teradata/informatica/ODBC7.0/odbc.ini
TDExpress15.00.01_Sles10:/var/opt/teradata/informatica/tools/debugtools/ssgodbc/linux64 # vi /var/opt/teradata/informatica/ODBC7.0/lib/
TDExpress15.00.01_Sles10:/var/opt/teradata/informatica/tools/debugtools/ssgodbc/linux64 # cd /var/opt/teradata/informatica/ODBC7.0/lib/
TDExpress15.00.01_Sles10:/var/opt/teradata/informatica/ODBC7.0/lib # ls
DWase26r.so  DWdb226.so    DWifcl26r.so  DWmsss26.so     DWmysql26.so  DWora26.so    DWsqls26.so   DWtera26s.so   libDWmback.so   libodbcinst.so  vscnctdlg.so
DWase26.so   DWgplm26r.so  DWifcl26.so   DWmsss26s.so    DWoe26.so     DWpsql26r.so  DWtera26r.so  DWtrc26.so     libDWmbackw.so  libodbc.so
DWdb226r.so  DWgplm26.so   DWmsss26r.so  DWmsssdlg26.so  DWora26r.so   DWpsql26.so   DWtera26.so   libDWicu26.so  libDWssl26.so   odbccurs.so
TDExpress15.00.01_Sles10:/var/opt/teradata/informatica/ODBC7.0/lib # find / -name "tdat.so
>
TDExpress15.00.01_Sles10:/var/opt/teradata/informatica/ODBC7.0/lib # find / -name "tdata.so"
/opt/teradata/client/.ODBC_32_PRE130_BRIDGE/drivers/tdata.so
/opt/teradata/client/.ODBC_64_PRE130_BRIDGE/drivers/tdata.so
/opt/teradata/client/15.00/odbc_32/lib/tdata.so
/opt/teradata/client/15.00/odbc_64/lib/tdata.so
TDExpress15.00.01_Sles10:/var/opt/teradata/informatica/ODBC7.0/lib # vi /var/opt/teradata/informatica/ODBC7.0/odbc.ini
TDExpress15.00.01_Sles10:/var/opt/teradata/informatica/ODBC7.0/lib # cd /var/opt/teradata/informatica/tools/debugtools/ssgodbc/linux64
TDExpress15.00.01_Sles10:/var/opt/teradata/informatica/tools/debugtools/ssgodbc/linux64 # ./ssgodbc.linux64 -d DBC -u dbc -p dbc -v
Connected
ODBC version        = -03.52.0000-
DBMS name           = -Teradata-
DBMS version        = -15.00.0101  15.00.01.01-
Driver name         = -tdata.so-
Driver version      = -15.00.00.03-
Driver ODBC version = -03.51-

Enter SQL string: select 1 from dual;
Error for thread 0
{error} STATE=37000, CODE=46913927770501, MSG=[Teradata][ODBC Teradata Driver][Teradata Database] Syntax error, expected something like a name or a Unicode delimited identifier or an 'UDFCALLNAME' keyword or '(' between the 'from' keyword and the 'dual' keyword.
Enter SQL string: sel 1;
   1
   1


Part - 2 --/etc/bash.bashrc

if test -n "$SSH_CLIENT" -a -z "$PROFILEREAD" ; then
    . /etc/profile > /dev/null 2>&1
fi

if test "$is" != "ash" ; then
    #
    # And now let's see if there is a local bash.bashrc
    # (for options defined by your sysadmin, not SuSE Linux)
    #
    test -s /etc/bash.bashrc.local && . /etc/bash.bashrc.local
fi

TMP=/tmp; export TMP
TMPDIR=$TMP; export TMPDIR
ORACLE_HOSTNAME=tdgogate; export ORACLE_HOSTNAME
ORACLE_UNQNAME=orcl; export ORACLE_UNQNAME
ORACLE_BASE=/var/opt/teradata/oracle; export ORACLE_BASE
ORACLE_HOME=$ORACLE_BASE/product/11.2.0/db_1; export ORACLE_HOME
TERADATA_HOME=/opt/teradata/client/15.00/odbc_64/lib; export TERADATA_HOME
ODBCINI=/var/opt/teradata/informatica/ODBC7.0/odbc.ini; export ODBCINI
ORACLE_SID=orcl; export ORACLE_SID
PATH=/usr/sbin:$PATH; export PATH
PATH=$ORACLE_HOME/bin:$PATH; export PATH
ODBCHOME=/var/opt/teradata/informatica/ODBC7.0; export ODBCHOME
PATH=/var/opt/teradata/informatica/tomcat/bin:/var/opt/teradata/informatica/server/bin:/var/opt/teradata/informatica/tomcat/server/lib:$ODBCHOME/bin:$TERADATA_HOME/bin:$PATH; export PATH;
LD_LIBRARY_PATH=$ORACLE_HOME/lib:/lib:/usr/lib:/var/opt/teradata/informatica/tomcat/server/bin/:$ODBCHOME/lib; export LD_LIBRARY_PATH
CLASSPATH=$ORACLE_HOME/jlib:$ORACLE_HOME/rdbms/jlib; export CLASSPATH
INFRA_CODEPAGENAME=UTF-8; export INFRA_CODEPAGENAME
LANG=en_US.utf8; export LANG
LC_ALL=en_US.utf8; export LC_ALL

Part - 3 : entries in odbc.ini -- 

[ODBC Data Sources]
SQL Server Legacy Wire Protocol=DataDirect 7.0 SQL Server Legacy Wire Protocol
DB2 Wire Protocol=DataDirect 7.0 DB2 Wire Protocol
Informix Wire Protocol=DataDirect 7.0 Informix Wire Protocol
Oracle Wire Protocol=DataDirect 7.0 Oracle Wire Protocol
Sybase Wire Protocol=DataDirect 7.0 Sybase Wire Protocol
Teradata=DataDirect 7.0 Teradata
SQL Server Wire Protocol=DataDirect 7.0 SQL Server Wire Protocol
MySQL Wire Protocol=DataDirect 7.0 MySQL Wire Protocol
PostgreSQL Wire Protocol=DataDirect 7.0 PostgreSQL Wire Protocol
Greenplum Wire Protocol=DataDirect 7.0 Greenplum Wire Protocol
Progress OpenEdge Wire Protocol=DataDirect 7.0 Progress OpenEdge Wire Protocol
default=tdata.so
DBC=tdata.so

[ODBC]
IANAAppCodePage=4
InstallDir=/var/opt/teradata/informatica/ODBC7.0
Trace=1
TraceFile=odbctrace.out
TraceDll=/var/opt/teradata/informatica/ODBC7.0/lib/DWtrc26.so

[DBC]
Driver=/opt/teradata/client/15.00/odbc_64/lib/tdata.so
Description=DataDirect 7.0 Teradata
AccountString=
AuthenticationDomain=
AuthenticationPassword=
AuthenticationUserid=
CharacterSet=ASCII
DBCName=dbc
Database=dbc
EnableDataEncryption=0
EnableExtendedStmtInfo=0
EnableLOBs=1
EnableReconnect=0
IntegratedSecurity=0
LoginTimeout=20
LogonID=dbc
MapCallEscapeToExec=0
MaxRespSize=8192
Password=
PortNumber=1025
PrintOption=N
ProcedureWithSplSource=Y
ReportCodePageConversionErrors=0
SecurityMechanism=
SecurityParameter=
ShowSelectableTables=1
TDProfile=
TDRole=
TDUserName=


And all above this will be available in details on -- https://www.youtube.com/watch?v=YyDOxbwRi0k

Follow the exact steps mentioned in video..


Tuesday 30 December 2014

Chapter 15 : Insurance

Chapter 15 : Insurance

Pay-in-Advance Metrics
Business management wants to know how much premium revenue was written
(or sold) each month, as well as how much revenue was earned. In this case we
can’t derive revenue metrics merely by summarizing the detailed policy transactions.
While a policyholder may contract and pay for specific coverages on
specific covered items for a period of time, the revenue is not earned until the
service is provided. In the case of the insurance company, the revenue from a
policy is earned month by month as long as the customer doesn’t cancel the policy.
Acorrect calculation of a metric such as earned premium would mean fully
replicating all the business rules of the operational revenue-recognition system
within the data warehouse access application. Typically, the rules for converting
a transaction amount into its monthly revenue impact are very complex, especially
with coverage upgrades and downgrades. Fortunately, these metrics can
be sourced from a separate operational revenue-recognition system.
As we see in the periodic snapshot in Figure 15.4, we include two premium
revenue metrics in the fact table to handle the different definitions of written
versus earned revenue. Simplistically, if an annual policy for a given coverage
and covered item was written on January 1 for a cost of $600, then the written
premium for January would be $600, whereas the earned premium is $50 ($600
divided by 12 months). In February, the written premium is zero, whereas the
earned premium is still $50. If the policy is canceled on March 31, the earned
premium for March is $50, whereas the written premium is a negative $450.
Obviously, at this point the earned-revenue stream comes to a crashing halt.
Pay-in-advance business scenarios typically require the combination of a
transaction-grained fact table and a monthly snapshot-grained fact table in
order to answer questions of transaction frequency and timing, as well as
questions of earned income in a given month. We can almost never add
enough facts to a snapshot schema to do away with the need for a transaction
schema, or vice versa


Multivalued Dimensions Again
Automobile insurance provides us with another opportunity to discuss multivalued
dimensions. Often multiple insured drivers are associated with a policyholder.
We can construct a bridge table, as illustrated in Figure 15.5, to
capture the relationship between the insured drivers and the policyholder. In
this case the insurance company can calculate the weighting factor more realistically
based on each driver’s share of the total premium cost. We also can
assign begin and end dates to the bridge table rows to capture relationship
changes over time, as required.


Factless Accident Events
When we discussed factless fact tables in Chapter 12, we referred to them as the
collision of keys at a point in space and time. In the case of an automobile
insurer, we can record literal collisions using a factless fact table. In this situation
the fact table registers the many-to-many correlations between the loss parties
and loss items or, to put it less euphemistically, all the correlations between the
people and vehicles involved in an accident.
Several new dimensions appear in the factless fact table shown in Figure 15.11.
The loss party describes other individuals who were involved in the accident,
possibly as passengers, witnesses, or in another capacity. If the loss party was
not associated with a vehicle in the accident, then the loss vehicle key would
join to a “No Vehicle” entry in that dimension. The loss affiliation explains the
role of the loss party (and loss vehicle, if applicable) to the claim. Again, as we
did in Chapter 12, we include a fact that is always valued at 1 to facilitate
counting and aggregation. This factless fact table can represent complex accidents
involving many individuals and vehicles because the number of
involved parties with various roles is open-ended. When there is more than
one claimant or loss party associated with an accident, we can optionally treat
these dimensions as multivalued dimensions using claimant group and loss
party group bridge tables. This has the advantage that the grain of the fact
table is preserved as one record per accident claim. Either schema variation
could answer questions such as “How many bodily injury claims did we handle
where ABC Legal Partners represented the claimant and EZ-Dent-B-Gone
body shop performed the repair?”


Common Dimensional Modeling Mistakes to Avoid
As we close this final chapter on dimensional modeling techniques, we
thought it would be helpful to establish boundaries beyond which designers
should not go. Thus far in this book we’ve presented concepts by positively
stating that you should use technique Ain situation X. Now, rather than focusing
on to-dos, we turn our attention to not-to-dos by elaborating on dimensional
modeling techniques that should be avoided. As we did with Chapter
1’s list of pitfalls, we’ve listed the not-to-dos in reverse order of importance. Be
aware, however, that even the less important mistakes can seriously compromise
your data warehouse.
Mistake 10: Place text attributes used for constraining and grouping in a
fact table. The process of creating a dimensional model is always a kind of
triage. The numeric measurements delivered from an operational business
process source belong in the fact table. The descriptive textual attributes
from the context of the measurements go in dimension tables. Finally, we
make a field-by-field decision about the leftover codes and pseudonumeric
items, placing them in the fact table if they are more like measurements
and in the dimension table if they are more like physical descriptions of
something. You shouldn’t lose your nerve and leave true text, expecially
comment fields, in the fact table. We need to get these text attributes off the
main runway of your data warehouse and into dimension tables.
Mistake 9: Limit verbose descriptive attributes in dimensions to save
space. You might think that you are being a good, conservative designer by
keeping the size of your dimensions under control. However, in virtually
every data warehouse, the dimension tables are geometrically smaller than
the fact tables. Having a 100-MB product dimension table is insignificant if
the fact table is 100 times as large! Your job as designer of an easy-to-use
data warehouse is to supply as much verbose descriptive context in each
dimension as you can. Make sure every code is augmented with readable
descriptive text. Better yet, you probably can remove the codes entirely.
Remember that the textual attributes in the dimension tables provide the
user interface to data browsing, constraining, or filtering, as well as the
content for the row and column headers in your final reports.
Mistake 8: Split hierarchies and hierarchy levels into multiple dimensions.
A hierarchy is a cascaded series of many-to-one relationships. For example,
many products may roll up to a single brand; and many brands may roll
up to a single category. If your dimension is expressed at the lowest level
of granularity (for example, product), then all the higher levels of the hierarchy
can be expressed as unique values in the product row. Users understand
hierarchies. Your job is to present the hierarchies in the most natural
and efficient manner. A hierarchy belongs together in a single physical flat
dimension table. Resist the urge to snowflake a hierarchy by generating a
set of progressively smaller subdimension tables. In this case you would be
confusing backroom data staging with front room data presentation!
Finally, if more than one roll-up exists simultaneously for a dimension, in
most cases it’s perfectly reasonable to include multiple hierarchies in the
same dimension, as long as the dimension has been defined at the lowest
possible grain (and the hierarchies are uniquely labeled).
Mistake 7: Ignore the need to track dimension attribute changes. Contrary
to popular belief, business users often want to understand the impact of
changes to a subset of the dimension tables’ attributes. It is unlikely that
your users will settle for dimension tables with attributes that always reflect
the current state of the world. We have three techniques for tracking slowly
moving attribute changes; don’t rely on type 1 exclusively. Likewise, if a
group of attributes changes rapidly, don’t delay splitting a dimension to
allow for a more volatile minidimension. You can’t always understand the
volatility of your data when you first design the dimensions. Suppose that
your product dimension contains a set of attributes called standard parameters.
At the beginning of the design process you are assured that these standard
parameters are fixed for the life of the product. However, after rolling
out your data warehouse, you discover that these attributes change several
times per year for each product. Sooner, rather than later, you probably
should separate your product dimension into two dimensions. The new
product standard parameter dimension will keep your original product
dimension from burgeoning disastrously if you tried to model it as slowly
changing.
Mistake 6: Solve all query performance problems by adding more hardware.
Aggregates, or derived summary tables, are the most cost-effective
way to improve query performance. Most query tool vendors have explicit
support for the use of aggregates, which depend on explicit dimensional
modeling constructs. Adding expensive hardware should be done as part
of a balanced program that includes building aggregates, creating indices,
choosing query-efficient DBMS software, increasing real memory size,
increasing CPU speed, and finally, adding parallelism at the hardware
level.
Mistake 5: Use operational or smart keys to join dimension tables to a fact
table. Novice data warehouse designers are sometimes too literal minded
when designing the dimension tables’ primary keys that connect to the foreign
keys of the fact table. It is counterproductive to declare a whole suite
of dimension attributes as the dimension table key and then use them all as
the basis of the physical join to the fact table. This includes the unfortunate
practice of declaring the dimension key to be the operational key, along
with an effective date. All types of ugly problems will arise eventually. You
should replace the smart physical key with a simple integer surrogate key
that is numbered sequentially from 1 to N, where N is the total number of
rows in the dimension table.
Mistake 4: Neglect to declare and then comply with the fact table’s grain.
All dimensional designs should begin with the business process that generates
the numeric performance measurements. Second, specify the exact
granularity of that data. Building fact tables at the most atomic, granular
level will gracefully resist the ad hoc attack. Third, surround these measurements
with dimensions that are true to that grain. Staying true to the
grain is a crucial step in the design of a dimensional data model. A subtle
but serious error in a dimensional design is to add helpful facts to a fact
table, such as rows that describe totals for an extended time span or a large
geographic area. Although these extra facts are well known at the time of
the individual measurement and would seem to make some applications
simpler, they cause havoc because all the automatic summations across
dimensions overcount these higher-level facts, producing incorrect results.
Each different measurement grain demands its own fact table.
Mistake 3: Design the dimensional model based on a specific report. A
dimensional model has nothing to do with an intended report! Rather, it is
a model of a measurement process. Numeric measurements form the basis
of fact tables. The dimensions that are appropriate for a given fact table are
the physical context that describes the circumstances of the measurements.
We see that a dimensional model is based solidly on the physics of a measurement
process and is quite independent of how a user chooses to define
a report. A project team once confessed to us that they had built several
hundred fact tables to deliver order management data to their users. It
turned out that each fact table had been constructed to address a specific
report request. The same data was being extracted many, many times to
populate all these fact tables. Not surprisingly, the team was struggling to
update the databases within the nightly batch window. Rather than
designing a quagmire of report-centric schemas, they should have focused
on the measurement process(es). The users’ requirements could have been
handled with a well-designed schema for the atomic data along with a
handful (not hundreds) of performance-enhancing aggregations.
Mistake 2: Expect users to query the lowest-level atomic data in a normalized
format. The lowest-level data is always the most dimensional and
should be the foundation of your dimensional design. Data that has been
aggregated in any way has been deprived of some of its dimensions. You
can’t build a data mart with aggregated data and expect your users and
their tools to seamlessly drill down to third normal form data for the
atomic details. Normalized models may be helpful for staging the data, but
they should never be used for presenting the data to business users.
Mistake 1: Fail to conform facts and dimensions across separate fact tables.
This final not-to-do should be presented as two separate mistakes because
they are both so dangerous to a successful data warehouse environment,
but we’ve run out of mistake numbers to assign, so we’ve lumped them
into one.
It would be a shame to get this far and then build isolated data stovepipes.
We refer to this as snatching defeat from the jaws of victory. If you have a
numeric measured fact, such as revenue, in two or more data marts
sourced from different underlying systems, then you need to take special
care to ensure that the technical definitions of these facts match exactly. If
the definitions do not match exactly, then they shouldn’t both be referred
to as revenue. This is called conforming the facts.
Finally, the single most important design technique in the dimensional
modeling arsenal is conforming your dimensions. If two or more fact
tables have the same dimension, then you must be fanatical about making
these dimensions identical or carefully chosen subsets of each other. When
you conform your dimensions across fact tables, you will be able to drill
across separate data sources because the constraints and row headers mean
the same thing and match at the data level. Conformed dimensions are the
secret sauce needed for building distributed data warehouses, adding
unexpected new data sources to an existing warehouse, and making
multiple incompatible technologies function together harmoniously.

Chapter 13 : Health Care

Chapter 13 : Health Care

There are two main types of patient treatment records. The treatment billing
record corresponds to a line item on a patient bill from a provider’s office, a
clinic, a hospital, or a laboratory. The treatment medical record, on the other
hand, is more comprehensive and includes not only the treatments that result
in charges but also all the laboratory tests, findings, and provider’s notes during
the course of treatment. The issues involved in these two kinds of records
are quite different, and we will look at them in separate sections.
Our large health care consortium must be able to share treatment billing
records smoothly from organization to organization. Billing records from all
the different kinds of providers must have a complete set of common dimensions
in order to be processed by the insurance companies and medical bill
payers. As individuals move from location to location, employer to employer,
and insurance company to government health care program, a coherent picture
of that individual’s history needs to be creatable at any time. And finally,
on the scrimmage line of health care delivery, the medical records of a patient
need to be available on short notice for legitimate medical use by any of the

primary providers.


We will choose the accumulating snapshot grain for our health care bill. Asingle
row in our fact table will represent a single line item on a health care bill.
Furthermore, this single row will represent the accumulated history of that
line item from the moment of creation of the row to the current day. When anything
about the line item changes, we revisit the unique accumulating row and
modify the row appropriately. From the point of view of the billing organization,
we’ll assume that the standard scenario of a bill includes:
 Treatment date
 Primary insurance billing date
 Secondary insurance billing date
 Responsible party billing date
 Last primary insurance payment date
 Last secondary insurance payment date
 Last responsible party payment date
We choose these dates to be an adequate description of a normal bill. An accumulating
snapshot does not attempt to describe unusual situations fully. If the
business users occasionally need to see all the details of a particularly messy
bill payment situation, then a companion transaction grained fact table would
be needed. The purpose of the accumulating snapshot grain is to place every
health care bill into a uniform framework so that the business objectives we
described earlier can be satisfied easily.
Now that we have a clear idea of what an individual fact table row represents
(for example, the accumulated history of a line item on a health care bill), we
can complete the list of dimensions by carefully listing everything we know to
be true in the context of this row. In our hypothetical billing organization, we
know the responsible party, employer, patient, provider, provider organization,
treatment performed, treatment location, diagnosis, primary insurance
organization, secondary insurance organization, and master bill ID number.
These become our dimensions, as shown in Figure 13.2.

The interesting facts that we choose to accumulate over the history of the line
item on the health care bill include the billed amount, primary insurance paid
amount, secondary insurance paid amount, responsible party paid amount,
total paid amount (calculated), amount sent to collections, amount written off,
amount remaining to be paid (calculated), number of treatment units (depending
on treatment type), treatment duration, number of days from billing to first
primary insurance payment, number of days from billing to first secondary
insurance payment, and number of days from billing to first responsible party
payment.


Roles Played By the Date Dimension

Accumulating snapshot fact tables always involve multiple date stamps. Our
example, which is typical, has seven foreign keys pointing to the date dimension.
This is a good place to reiterate several important points:
The foreign keys in the fact table cannot be actual date stamps because
they have to handle the “Not Applicable” case. The foreign keys should
be simple integers serving as surrogate keys.
The surrogate keys assigned in the date dimension should be assigned
consecutively in order of date. This is the only dimension where the
surrogate keys have any relationship to the underlying semantics of the
dimension. We do this so that physical partitioning of a fact table can be
accomplished by using one of the date-based foreign keys. In our example
we recommend that the treatment date key be used as the basis for physically
partitioning the fact table.
Surrogate keys corresponding to special conditions such as “Not Applicable,”
“Corrupted,” or “Hasn’t Happened Yet” should be assigned to the
top end of the numeric range so that these rows are physically partitioned
together in the hot partition with the most recent data. We do this if these
rows are ones that are expected to change.
We do not join the seven date-based foreign keys to a single instance of
the date dimension table. Such a join would demand that all seven dates
were the same date. Instead, we create seven views on the single underlying
date dimension table, and we join the fact table separately to these
seven views, just as if they were seven independent date dimension
tables. This allows the seven dates to be independent. We refer to these
seven views as roles played by the date dimension table.
The seven view definitions using the date dimension table should cosmetically
relabel the column names of each view to be distinguishable so that
query tools directly accessing the views will present the column names
through the user interface in a way that is understandable to the end user.

Although the role-playing behavior of the date dimension is very characteristic
of accumulating snapshot fact tables, other dimensions often play roles in
similar ways, such as the payer dimension in Figure 13.2. Later in this chapter
we will see how the physician dimension needs to have several roles in complex
surgical procedures depending on whether the physician is the primary
responsible physician, working in a consulting capacity, or working in an

assisting capacity.

If there were always a maximum of three diagnoses, for instance, we might be
tempted to create three diagnosis dimensions, almost as if they were roles.
However, diagnoses don’t behave like roles. Unfortunately, there are often
more than three diagnoses, especially for elderly patients who are hospitalized.
Real medical bill-paying organizations sometimes encounter patients
with more than 50 diagnoses! Also, the diagnoses don’t fit into well-defined
roles other than possibly admitting diagnosis and discharging diagnosis. The
role-playing dimensions we talked about in the preceding section are categorized
much more naturally and disjointly. Finally, the multiple-slots style of
design makes for very inefficient applications because the query doesn’t know
a priori which dimensional slot to constrain for a particular diagnosis.
We handle the open-ended nature of multiple diagnoses with the design
shown in Figure 13.3. We replace the diagnosis foreign key in the fact table
with a diagnosis group key. This diagnosis group key is connected by a manyto-
many join to a diagnosis group bridge table, which contains a separate row
for each diagnosis in a particular group.


If a patient has three diagnoses, then that patient is assigned a diagnosis group
with three diagnoses. We assign a numerical weighting factor to each diagnosis
in the group such that the sum of all the weighting factors in the group is exactly
1.00. We can then use the weighting factors to allocate any of the numeric additive
facts across individual diagnoses. In this way we can add up all billed
amounts by diagnosis, and the grand total will be the correct grand total billed
amount. This kind of report would be called a correctly weighted report.

Finally, if the many-to-many join in Figure 13.3 causes problems for your modeling
tool that insists on proper foreign-key-to-primary-key relationships, the
equivalent design of Figure 13.4 can be used. In this case an extra table whose
primary key is diagnosis group is inserted between the fact table and the bridge

table. Now both the fact table and the bridge table have conventional many-toone
joins in all directions. There is no new information in this extra table.

Fact Dimension for Sparse Facts
We handle the extreme variability of the medical record entry with a special
dimension we call a fact dimension. In Figure 13.8 the entry type is a fact dimension
that describes what the row means or, in other words, what the fact
represents. The entry type dimension also determines which of the four kinds
of fact fields (amount, flag, comment, and JPEG file name) are valid for the
specific entry and how to interpret each field. For example, the generic amount
column is used for every numeric entry. The unit of measure for a given
numeric entry is found in the attached entry type dimension row, along with
any additivity restrictions. If the entry is a flag (for example, Yes/No or High/
Medium/Low), the types of flag values are found in the entry type dimension.
If the entry is a free-text comment or a multimedia object such as JPEG graphic
image or photograph, the entry type dimension alerts the requesting application

to look in these fact table fields.


This approach is elegant because it is superbly flexible. We can add new measurement
types just by adding new rows in the fact dimension, not by altering
the structure of the fact table. We also eliminate the nulls in the classic positional
fact table design because a row exists only if the measurement exists.
However, there are some significant tradeoffs. Using a fact dimension may
generate lots of new fact table rows. If an event resulted in 10 numeric measurements,
we now have 10 rows in the fact table rather than a single row in
the classic design. For extremely sparse situations, such as clinical/laboratory
or manufacturing test environments, this is a reasonable compromise. However,
as the density of the facts grows, we end up spewing out too many fact
rows. At this point we no longer have sparse facts and should return to the
classic fact table approach.

Late-Arriving Fact Rows
Using our patient treatment scenario, suppose that we receive today a treatment
row that is several months old. In most operational data warehouses we
are willing to insert this late-arriving row into its correct historical position,
even though our summaries for the prior month will now change. However,
we must choose the old contemporary dimension rows that apply to this
treatment carefully. If we have been date stamping the dimension rows in our
type 2 SCDs, then our processing involves the following steps:
1. For each dimension, find the corresponding dimension row whose date
stamp is the latest date stamp less than or equal to the date of the treatment.
2. Using the surrogate keys found in the each of the dimension rows from
step 1, replace the natural keys of the late-arriving fact row with the
surrogate keys.
3. Insert the late-arriving fact row into the correct physical partition of the
database containing the other fact rows from the time of the late-arriving
treatment.

Late-Arriving Dimension Rows
A late-arriving dimension row presents an entirely different set of issues that,
in some ways, are more complex than a late-arriving fact row. Suppose that
John Doe’s patient dimension row contains a marital flag attribute that always
contained the value “Single.” We have a number of patient rows for John Doe
because this is a slowly changing dimension and other attributes such as
John’s address and employment status have changed over the past year or two.
Today we are notified that John Doe was married on July 15, 1999 and has been
married ever since. To add this new information to the data warehouse
requires the following steps:
1. Insert a fresh row, with a new surrogate key, for John Doe into the patient
dimension with the marital status attribute set to “Married” and the effective
date set to “July 15, 1999.”
2. Scan forward in the patient dimension table from July 15, 1999, finding
any other rows for John Doe, and destructively overwrite the marital
status field to “Married.”
3. Find all fact rows involving John Doe from July 15, 1999 to the first next
change for him in the dimension after July 15, 1999 and destructively
change the patient foreign key in those fact rows to the new surrogate key
created in step 1.

This is a fairly messy change, but you should be able to automate these steps
in a good programmable ETL environment. We have some subtle issues in this
case, too. First, we need to check to see if some other change took place for
John Doe on July 15, 1999. If so, then we only need to perform step 2. We don’t
need a new dimension row in this special case.
Second, since we are using a pair of date stamps in each product dimension
row, we need to find the closest previous to July 15 patient row for John Doe
and change its end date to July 15, 1999, and we also need to find the closest
subsequent to July 15 patient row for John Doe and set the end date for the July
15, 1999 entry to the begin date of that next row. Got it?

Monday 29 December 2014

Chapter 12 : Education

Chapter 12 : Education

In the case of applicant tracking, prospective students progress through a
standard set of admissions hurdles or milestones. Perhaps we’re interested in
tracking activities around key dates, such as receipt of preliminary admissions
test scores, information requested (via Web or otherwise), information sent,
interview conducted, on-site campus visit, application received, transcript
received, test scores received, recommendations received, first pass review by
admissions, review for financial aid, final decision from admissions, accepted,
244 CHAPT E R 12
admitted, and enrolled. At any point in time, people in the admissions and
enrollment management area are interested in how many applicants are at
each stage in the pipeline. The process is much like a funnel, where many
applicants enter the pipeline, but far fewer progress through to the final stage.
Admission personnel also would like to analyze the applicant pool by a variety
of characteristics.
The grain of the accumulating snapshot to track the applicant’s lifecycle is one
row per prospective student. This granularity represents the lowest level of
detail captured when the prospect enters the pipeline. As more information is
collected while the prospect progresses toward application, acceptance, and
admission, we continue to revisit and update the prospect’s status in the fact
table row, as illustrated in Figure 12.1.


Student Registration Events
There are many situations in which events need to be recorded as the simultaneous
coming together of a number of dimensional entities. For example, we
can track student registrations by term. The grain of the fact table would be
one row for each registered course by student and term. As illustrated in Figure
12.2, the fact table has the following dimensionality: term, student, student
major and attainment, course, and faculty.
In this scenario we’re dealing with fact data at the term level rather than at the
more typical calendar day, week, or month granularity. Term is the lowest level
available for the registration events. The term dimension still should conform
to the calendar date dimension. In other words, each date in our daily calendar
dimension should identify the term (for example, Fall AY2002), academic year
(for example, AY2002), and term season (for example, Winter). The column
labels and values must be identical for the attributes common to both the
calendar date and term dimensions


Events often are modeled as a fact table containing a series of keys, each representing
a participating dimension in the event. Event tables often have no obvious numeric
facts associated with them and hence are called factless fact tables.

The inevitable confusion surrounding the SQL statement, while not a serious
semantic problem, causes some designers to create an artificial implied fact,
perhaps called registration count (as opposed to dummy), that is always populated
by the value 1. While this fact does not add any information to the fact
table, it makes the SQL more readable, such as:
SELECT FACULTY, SUM(REGISTRATION_COUNT)... GROUP BY FACULTY
At this point the table is no longer strictly factless, but most would agree that
the 1 is nothing more than an artifact.


Explicit Rows for What Didn’t Happen
Perhaps people are interested in monitoring students who were registered for
a course but didn’t show up. In this example we can envision adding explicit
rows to the fact table for attendance events that didn’t occur. Adding rows is
viable in this scenario because the nonattendance events have the same exact
dimensionality as the attendance events. Likewise, the fact table won’t grow at
an alarming rate, presuming (or perhaps hoping) that the no shows are a small
percentage of the total students registered for a course. In this situation we’re
no longer dealing with a factless fact table because now the attendance fact
would equal either 1 or 0.
While this approach is reasonable in this scenario, creating rows for events that
didn’t happen is ridiculous in many situations. For example, if we think back
to our transportation case study, we certainly don’t want to build fact table
rows for each flight not taken by a frequent flyer on a given day.


Chapter 11 : Transportation

Chapter 11 : Transportation

Multiple Fact Table Granularity
When it comes to the grain, we encounter a situation in this case where we are
presented with multiple potential levels of fact table granularity. Each of these
levels of granularity has different metrics associated with them.
At the most granular level, the airline captures data at the leg level. The leg
represents an aircraft taking off at one airport and landing at another without
any intermediate stops. Capacity planning and flight scheduling analysts are
very interested in this discrete level of information because they’re able to look
at the number of seats to calculate load factors by leg. We also can include facts
regarding the leg’s flight duration as well as the number of minutes late at
departure and arrival. Perhaps there’s even a dimension to easily identify
on-time arrivals.
The next level of granularity corresponds to a segment. In this case we’re
looking at the portion of a trip on a single aircraft. Segments may have one or
more legs associated with them. If you take a flight from San Francisco to
Minneapolis with a stop in Denver but no aircraft change, you have flown one
segment (SFO-MSP) but two legs (SFO-DEN and DEN-MSP). Conversely, if
the flight flew nonstop from San Francisco to Minneapolis, you would have
flown one segment as well as one leg. The segment represents the line item on
an airline ticket coupon; revenue and mileage credit is generated at the segment
level.
Next, we can analyze flight activity by trip. The trip provides an accurate picture
of customer demand. In our prior example, assume that the flights from
San Francisco to Minneapolis required the flyer to change aircraft in Denver. In
this case the trip from San Francisco to Minneapolis would entail two segments
corresponding to the two aircraft involved. In reality, the passenger just
asked to go from San Francisco to Minneapolis; the fact that he or she needed
to stop in Denver was merely a necessary evil but certainly wasn’t requested.
For this reason, sales and marketing analysts are interested in trip-level data.


Linking Segments into Trips
Despite the powerful dimensional framework we just designed, we are unable
to easily answer one of the most important questions about our frequent flyers,
namely, where are they going? The segment grain masks the true nature of
the trip. If we fetch all the segments of the airline voyage and sequence them
by segment number, it is still nearly impossible to discern the trip start and end
points. Most complete itineraries start and end at the same airport. If a lengthy
stop were used as a criterion for a meaningful trip destination, it would
require extensive and tricky processing whenever we tried to summarize a
number of voyages by the meaningful stops.
The answer is to introduce two more airport role-playing dimensions: trip origin
and trip destination, while keeping the grain at the flight segment level.
These are determined during data extraction by looking on the ticket for any
stop of more than four hours, which is the airline’s official definition of a
stopover. The enhanced schema looks like Figure 11.2. We would need to exercise
some caution when summarizing data by trip in this schema. Some of the
dimensions, such as fare basis or class of service flown, don’t apply at the trip
level. On the other hand, it may be useful to see how many trips from San
Francisco to Minneapolis included an unrestricted fare on a segment


In addition to linking segments into trips as Figure 11.2 illustrates, if the business
users are constantly looking at information at the trip level, rather than by segment,
we might be tempted to create an aggregate fact table at the trip grain.
Some of the earlier dimensions discussed, such as class of service, fare basis, and
flight, obviously would not be applicable. The facts would include such metrics
as trip gross revenue and additional facts that would appear only in this complementary
trip summary table, such as the number of segments in the trip.
However, we would only go to the trouble of creating such an aggregate table if
there were obvious performance or usability issues when we used the segmentlevel
table as the basis for rolling up the same reports. If a typical trip consisted
of three segments, then we might barely see a three times performance improvement
with such an aggregate table, meaning that it may not be worth the bother.


Cargo Shipper
The schema for a cargo shipper looks quite similar to the frequent flyer schemas
just developed. Suppose that a transoceanic shipping company transports bulk
goods in containers from foreign to domestic ports. The items in the containers
are shipped from an original shipper to a final consignor. The trip can have multiple
stops at intermediate ports. It is possible that the containers may be offloaded
from one ship to another at a port. Likewise, it is possible that one or
more of the legs may be by truck rather than ship.
As illustrated in Figure 11.3, the grain of the fact table is the container on a specific
bill-of-lading number on a particular leg of its trip.
The ship mode dimension identifies the type of shipping company and specific
vessel. The item dimension contains a description of the items in a container.
The container dimension describes the size of the container and whether it
requires electrical power or refrigeration. The commodity dimension describes
one type of item in the container. Almost anything that can be shipped can be
described by harmonized commodity codes, which are a kind of master conformed
dimension used by agencies, including U.S. Customs. The consignor
foreign transporter, foreign consolidator, shipper, domestic consolidator,
domestic transporter, and consignee are all roles played by a master business
entity dimension that contains all the possible business parties associated with
a voyage. The bill-of-lading number is a degenerate dimension. We assume that
the fees and tariffs are applicable to the individual leg of the voyage.
Travel Services


If we work for a travel services company, we can envision complementing the
customer flight activity schema with fact tables to track associated hotel stays
and rental car usage. These schemas would share several common dimensions,
such as the date, customer, and itinerary number, along with ticket and
segment number, as applicable, to allow hotel stays and car rentals to be interleaved
correctly into a airline trip. For hotel stays, the grain of the fact table is
the entire stay, as illustrated in Figure 11.4. The grain of a similar car rental fact
table would be the entire rental episode. Of course, if we were constructing a
fact table for a hotel chain rather than a travel services company, the schema
would be much more robust because we’d know far more about the hotel property
characteristics, the guest’s use of services, and associated detailed charges

Combining Small Dimensions into a Superdimension
We stated previously that if a many-to-many relationship exists between two
groups of dimension attributes, then they should be modeled as separate
dimensions with separate foreign keys in the fact table. Sometimes, however,
we’ll encounter a situation where these dimensions can be combined into a
single superdimension rather than treating them as two separate dimensions
with two separate foreign keys in the fact table
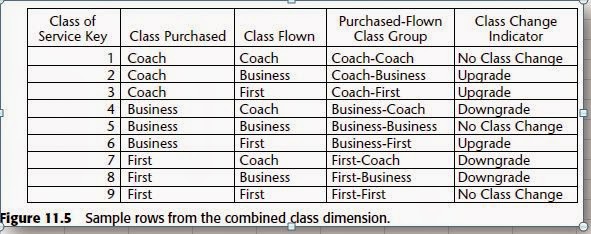
Class of Service
The Figure 11.1 draft schema included the class of service flown dimension. Following
our first design checkpoint with the business community, we learn that
the business users want to analyze the class of service purchased, as well as the
class flown. Unfortunately, we’re unable to reliably determine the class of service
actually used from the original fare basis because the customer may do a
last-minute upgrade. In addition, the business users want to easily filter and
report on activity based on whether an upgrade or downgrade occurred. Our
initial reaction is to include a second role-playing dimension and foreign key in
the fact table to support access to both the purchased and flown class of service,
along with a third foreign key for the upgrade indicator. In this situation, however,
there are only three rows in each class dimension table to indicate first,
business, and coach classes. Likewise, the upgrade indicator dimension also
would have just three rows in it, corresponding to upgrade, downgrade, or no
class change. Since the row counts are so small, we elect instead to combine the
dimensions into a single class of service dimension, as illustrated in Figure 11.5.


In most cases, role-playing dimensions should be treated as separate logical dimensions
created via views on a single physical table, as we’ve seen earlier with date
dimensions. In isolated situations it may make sense to combine the separate
dimensions into a superdimension, notably when the data volumes are extremely
small or there is a need for additional attributes that depend on the combined
underlying roles for context and meaning.

Country-specific calendar outrigger.


If there’s no need to roll up or filter on time-of-day groups, then we have the
option to treat time as a simple numeric fact instead. In this situation, the time
of day would be expressed as a number of minutes or number of seconds since
midnight, as shown in Figure 11.8
Date and Time in Multiple Time Zones
When operating in multiple countries or even just multiple time zones, we’re
faced with a quandary concerning transaction dates and times. Do we capture
the date and time relative to local midnight in each time zone, or do we express
the time period relative to a standard, such as the corporate headquarters
date/time or Greenwich Mean Time (GMT)? To fully satisfy users’ requirements,
the correct answer is probably both. The standard time allows us to see
the simultaneous nature of transactions across the business, whereas the local
time allows us to understand transaction timing relative to the time of day.
Contrary to popular belief, there are more than 24 time zones (corresponding
to the 24 hours of the day) in the world. For example, there is a single time
zone in India, offset from GMT by 5.5 or 6.5 hours depending on the time of
year. The situation gets even more unpleasant when you consider the complexities
of switching to and from daylight saving time. As such, it’s unreasonable
to think that merely providing an offset in a fact table can support
equivalized dates and times. Likewise, the offset can’t reside in a time or airport
dimension table. The recommended approach for expressing dates and
times in multiple time zones is to include separate date and time-of-day
dimensions (or time-of-day facts, as we just discussed) corresponding to the
local and equivalized dates, as shown in Figure 11.9.


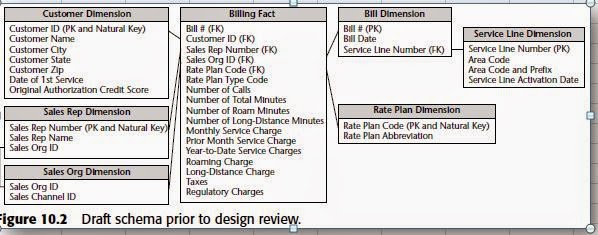
Chapter 10 : Telecommunication

Chapter 10 : Telecommunication


Geographic Location Dimension
Let’s shift gears and presume that we’re now working for a phone company
with land lines tied to a specific physical location. In general, the telecommunications
industry has a very well-developed notion of location. The same
could be said for the utilities industry. Many of its dimensions contain a precise
geographic location as part of the attribute set. The location may be resolved to
a physical street, city, state, and ZIP code or even to a specific latitude and longitude.
Using our dimension role-playing technique, we imagine building a
single master location table where data is standardized once and then reused.
The location table could be part of the service line telephone number, equipment
inventory, network inventory (including poles and switch boxes), real
estate inventory, service location, dispatch location, right of way, and even customer
entities. Each row in the master location table is a specific point in space
that rolls up to every conceivable geographic grouping, such as census tracts
and counties. A location could roll up to multiple unique geographic groupings
simultaneously.


Chapter 9 : Financial Services

Chapter 9 : Financial Services

The financial services industry encompasses a wide variety of businesses,
including credit card companies, brokerage firms, and mortgage providers.
This chapter will focus primarily on retail banks given that most readers have
some degree of personal familiarity with this type of financial institution. A
full-service bank offers a breadth of products, including checking accounts,
savings accounts, mortgage loans, personal loans, credit cards, and safe
deposit boxes. This chapter begins with a very simplistic schema. We then
explore several schema extensions, including handling of the bank’s broad
portfolio of heterogeneous products that vary significantly by line of business


Causal dimensions. These dimensions, such as promotion, contract, deal,
store condition, or even weather, provide additional insight into the cause
of an event.
Multiple date or time-stamp dimensions. Refer to Chapter 5 for sample fact
tables with multiple date stamps, especially when the fact table is an accumulating
snapshot.
Degenerate dimensions. These dimensions identify operational transaction
control numbers, such as an order, invoice, bill of lading, or ticket, as illustrated
initially in Chapter 2.
Role-playing dimensions. Role-playing occurs when a single physical
dimension appears several times in a fact table, each represented as a
separate logical table with unique column names through views.
Status dimensions. These dimensions identify the current status of a transaction
or monthly snapshot within some larger context, such as an account
status.
Audit dimension. As discussed in Chapter 8, this dimension is designed to
track data lineage and quality.
Junk dimensions. These consist of correlated indicators and flags, as
described in Chapter 5.


Minidimensions
It is unreasonable to rely on the type 2 SCD technique to track changes in the
account dimension given the dimension row count and attribute volatility,
such as the monthly update of credit bureau attributes. Instead, we break off
the browseable and changeable attributes into multiple minidimensions, such
as credit bureau and demographics minidimensions, whose keys are included
in the fact table. This recommendation was illustrated in Figure 6.4. The minidimensions
allow us to slice and dice the fact data based on a lengthy list of
attributes while readily tracking attribute changes over time, even though they
may be updated at different frequencies. While minidimensions are extremely
powerful, we need to be careful that we don’t overuse the technique. However,
account-oriented financial services are a good environment for using the minidimension
technique because the primary fact table is a very long-running
periodic snapshot. Thus a fact table row exists for every account every month.
This fact row provides a home for all the foreign keys and links them together
so that we can always see the account together with all the other minidimensions
for any month.
Minidimensions should consist of correlated clumps of attributes; each attribute
shouldn’t be its own minidimension or we’d end up with too many dimensions
in the fact table.
As described in Chapter 6, one of the compromises associated with minidimensions
is the need to band attribute values in order to maintain reasonable
minidimension row counts. Rather than storing extremely discrete income
amounts, such as $31,257.98, we store income ranges, such as $30,000-$34,999
in the minidimension. Similarly, the profitability scores may range from 1
through 1,200, which we band into fixed ranges such as less than or equal to
100, 101-150, 151-200, and so on in the minidimension.

Household Dimension
From the bank’s perspective, a household may be comprised of several
accounts and individual account holders. For example, consider John and
Mary Smith as a single household. John has a checking account, and Mary has
a savings account. In addition, John and Mary have a joint checking account,
credit card, and mortgage with the bank. All five of these accounts are considered
to be a part of the same Smith household despite the fact that minor
inconsistencies may exist in the operational name and address information
The decision to treat accounts and households as separate dimensions is somewhat
a matter of the designer’s prerogative. Despite the fact that accounts and
households are correlated intuitively, we decide to treat them separately
because of the size of the account dimension and the volatility of the account
constituents within a household dimension, as referenced earlier.

Multivalued Dimensions
As we just saw in the John and Mary Smith example, an account can have one,
two, or more individual account holders, or customers, associated with it.
Obviously, we cannot merely include the customer as an account attribute;
doing so violates the granularity of the dimension table because more than one
individual can be associated with an account. Likewise, we cannot include
customer as an additional dimension in the fact table; doing so violates the
granularity of the fact table (one row per account per month) again because
more than one individual can be associated with any given account. This is a
classic example of a multivalued dimension, which we’ll develop fully in
Chapter 13. For now, suffice it to say that to link an individual customer
dimension to an account-grained fact table requires the use of an account-tocustomer
bridge table, as shown in Figure 9.3. At a minimum, the primary key
of the bridge table consists of the surrogate account and customer foreign
keys.
An open-ended many-valued attribute can be associated with a dimension row by
using a bridge table to associate the many-valued attributes with the dimension


Point-in-Time Balances
Assuming that business requirements already have driven the need to make
transaction detail data available for analysis, we could leverage this transaction
detail to determine an arbitrary point-in-time balance. To simplify matters,
we’ll boil the account transaction fact table down to an extremely simple
design, as illustrated in Figure 9.5. The transaction type key joins to a small
dimension table of permissible transaction types. The transaction sequence
number is a continuously increasing numeric number running for the
lifetime of the account. The final flag indicates whether this is the last
transaction for an account on a given day. The transaction amount is selfexplanatory.
The balance fact is the ending account balance following the
transaction event.
Like all transaction-grained fact tables, we add a row to the fact table in
Figure 9.5 only if a transaction occurs. If an account were quiet for two weeks,
perhaps January 1 through 14, there would be no rows in the fact table for the
account during that time span.


Leveraging the transaction fact table for dual purposes requires that the fact
table is absolutely complete and accurate. Every transaction against the
account must appear in this fact table, or else the running balance will not be
accurate. A late-arriving transaction row would require sweeping forward
from the point of insertion in that account and incrementing all the balances
and transaction sequence numbers. Note that we haven’t explicitly used the
transaction sequence number in this discussion, although it is needed in this
design to reconstruct the true sequence of transactions reliably and to provide
the basis of the fact table’s primary key, which is the date, account, and
sequence number. We prefer using the sequence number rather than a time-ofday
stamp because differences between the sequence numbers are a valid measure
of account activity.

Heterogeneous Product Schemas
The keys of the custom product dimensions are the same keys used in the core
product dimension, which contains all possible product keys. For example, if
the bank offers a $500 minimum balance with no per-check charge checking
product, the product would have the same surrogate key in both the core and
custom checking product dimensions. As we discussed in Chapter 3, establishing
conformed dimensions is essential to an extensible data warehouse
architecture. Each custom product dimension is a subset of rows from the core
product dimension table. Each custom product dimension contains attributes
specific to a particular product type.
This heterogeneous product technique obviously applies to any business that
offers widely varied products through multiple lines of business. If we worked
for a technology company that sells hardware, software, and services, we can
imagine building core sales fact and product dimension tables to deliver the
global customer perspective. The core tables would include all facts and
dimension attributes that are common across lines of business. The core tables
would then be supplemented with schemas that do a deep dive into custom
facts and attributes that vary by business. Again, a specific product would be
assigned the same surrogate product key in both the core and custom product
dimensions.


A family of core and custom fact tables is needed when a business has heterogeneous
products that have naturally different facts and descriptors but a single
customer base that demands an integrated view

Context-dependent dimension outriggers
In the case of account-oriented financial services, when a product is sold to a
customer, a new account is opened. In the case of some banking products, such
as mortgages, more account-specific descriptive information is collected when
the account opening occurs. For example, the bank may offer a 15-year fixedrate
mortgage at a given rate. When the mortgage originates, the bank will
know more about the specific property, including the address, appraised
value, square footage, home type (for example, single-family, townhouse, condominium,
trailer), construction type (for example, wood frame, brick,
stucco), date of construction, and acreage. These attribute values differ by
account, so they don’t belong in the what-the-bank-sells product dimension.
As shown in Figure 9.7, we can envision an account dimension outrigger for
some account types