Chapter 2 : Retail
Four-Step Dimensional Design Process
1. Select the business process to model.
2. Declare the grain of the business process.
3. Choose the dimensions that apply to each fact table row
4. Identify the numeric facts that will populate each fact table row
Step 2. Declare the Grain
Once the business process has been identified, the data warehouse team faces
a serious decision about the granularity. What level of data detail should be
made available in the dimensional model? This brings us to an important
design tip.
Preferably you should develop dimensional models for the most atomic information
captured by a business process. Atomic data is the most detailed information collected;
such data cannot be subdivided further.
Why date dimentions are needed
Some designers pause at this point to ask why an explicit date dimension table
is needed. They reason that if the date key in the fact table is a date-type field,
then any SQL query can directly constrain on the fact table date key and use
natural SQL date semantics to filter on month or year while avoiding a supposedly
expensive join. This reasoning falls apart for several reasons. First of
all, if our relational database can’t handle an efficient join to the date dimension
table, we’re already in deep trouble. Most database optimizers are quite
efficient at resolving dimensional queries; it is not necessary to avoid joins like
the plague. Also, on the performance front, most databases don’t index SQL
date calculations, so queries constraining on an SQL-calculated field wouldn’t
take advantage of an index.
In terms of usability, the typical business user is not versed in SQL date semantics,
so he or she would be unable to directly leverage inherent capabilities
associated with a date data type. SQL date functions do not support filtering
by attributes such as weekdays versus weekends, holidays, fiscal periods, seasons,
or major events. Presuming that the business needs to slice data by these
nonstandard date attributes, then an explicit date dimension table is essential.
At the bottom line, calendar logic belongs in a dimension table, not in the
application code. Finally, we’re going to suggest that the date key is an integer
rather than a date data type anyway. An SQL-based date key typically is 8 bytes,
so you’re wasting 4 bytes in the fact table for every date key in every row. More
will be said on this later in this chapter.
Casual Dimension
Promotion Dimension
The promotion dimension is potentially the most interesting dimension in our
schema. The promotion dimension describes the promotion conditions under
which a product was sold. Promotion conditions include temporary price
reductions, end-aisle displays, newspaper ads, and coupons. This dimension
is often called a causal dimension (as opposed to a casual dimension) because
it describes factors thought to cause a change in product sales.
Null Values
Typically, many sales transaction line items involve products that are not being
promoted. We will need to include a row in the promotion dimension, with its
own unique key, to identify “No Promotion in Effect” and avoid a null promotion
key in the fact table. Referential integrity is violated if we put a null in a
fact table column declared as a foreign key to a dimension table. In addition to
the referential integrity alarms, null keys are the source of great confusion to
our users because they can’t join on null keys.
You must avoid null keys in the fact table. A proper design includes a row in the
corresponding dimension table to identify that the dimension is not applicable
to the measurement
NonAdditive Facts
Percentages and ratios, such as gross margin, are nonadditive. The numerator and
denominator should be stored in the fact table. The ratio can be calculated in a data
access tool for any slice of the fact table by remembering to calculate the ratio of
the sums, not the sum of the ratios
Unit price is also a nonadditive fact. Attempting to sum up unit price across any
of the dimensions results in a meaningless, nonsensical number
Product Dimension
An important function of the product master is to hold the many descriptive
attributes of each SKU. The merchandise hierarchy is an important group of
attributes. Typically, individual SKUs roll up to brands. Brands roll up to
categories, and categories roll up to departments. Each of these is a many-toone
relationship. This merchandise hierarchy and additional attributes are
detailed for a subset of products in Figure 2.6.

Drill Down
A reasonable product dimension table would have 50 or more descriptive
attributes. Each attribute is a rich source for constraining and constructing row
headers. Viewed in this manner, we see that drilling down is nothing more
than asking for a row header that provides more information. Let’s say we
have a simple report where we’ve summarized the sales dollar amount and
quantity by department.

If we want to drill down, we can drag virtually any other attribute, such as
brand, from the product dimension into the report next to department, and we
automatically drill down to this next level of detail. Atypical drill down within
the merchandise hierarchy would look like this:

We have belabored the examples of drilling down in order to make a point,
which we will express as a design principle.
Drilling down in a data mart is nothing more than adding row headers from the
dimension tables. Drilling up is removing row headers. We can drill down or up on
attributes from more than one explicit hierarchy and with attributes that are part of
no hierarchy.
Degenerate dimension
Although the POS transaction number looks like a dimension key in the fact
table, we have stripped off all the descriptive items that might otherwise fall in
a POS transaction dimension. Since the resulting dimension is empty, we refer
to the POS transaction number as a degenerate dimension (identified by the DD
notation in Figure 2.10). The natural operational ticket number, such as the
POS transaction number, sits by itself in the fact table without joining to a
dimension table. Degenerate dimensions are very common when the grain of
a fact table represents a single transaction or transaction line item because the
degenerate dimension represents the unique identifier of the parent. Order
numbers, invoice numbers, and bill-of-lading numbers almost always appear
as degenerate dimensions in a dimensional model.
Operational control numbers such as order numbers, invoice numbers, and bill-oflading
numbers usually give rise to empty dimensions and are represented as degenerate
dimensions (that is, dimension keys without corresponding dimension tables)
in fact tables where the grain of the table is the document itself or a line item in the
document.

Factless Fact table
Promotion Coverage Factless Fact Table
Regardless of the handling of the promotion dimension, there is one important
question that cannot be answered by our retail sales schema: What products
were on promotion but did not sell? The sales fact table only records the SKUs
actually sold. There are no fact table rows with zero facts for SKUs that didn’t
sell because doing so would enlarge the fact table enormously. In the relational
world, a second promotion coverage or event fact table is needed to help
answer the question concerning what didn’t happen. The promotion coverage
fact table keys would be date, product, store, and promotion in our case study.
This obviously looks similar to the sales fact table we just designed; however,
the grain would be significantly different. In the case of the promotion coverage
fact table, we’d load one row in the fact table for each product on promotion
in a store each day (or week, since many retail promotions are a week in
duration) regardless of whether the product sold or not. The coverage fact
table allows us to see the relationship between the keys as defined by a promotion,
independent of other events, such as actual product sales. We refer to
it as a factless fact table because it has no measurement metrics; it merely captures
the relationship between the involved keys. To determine what products
where on promotion but didn’t sell requires a two-step process. First, we’d
query the promotion coverage table to determine the universe of products that
were on promotion on a given day. We’d then determine what products sold
from the POS sales fact table. The answer to our original question is the set difference
between these two lists of products.
Snlowflaking
Dimension table normalization typically is referred to as snowflaking

The dimension tables should remain as flat tables physically. Normalized,
snowflaked dimension tables penalize cross-attribute browsing and prohibit the use
of bit-mapped indexes. Disk space savings gained by normalizing the dimension tables
typically are less than 1 percent of the total disk space needed for the overall
schema. We knowingly sacrifice this dimension table space in the spirit of performance
and ease-of-use advantages.
Centipede fact
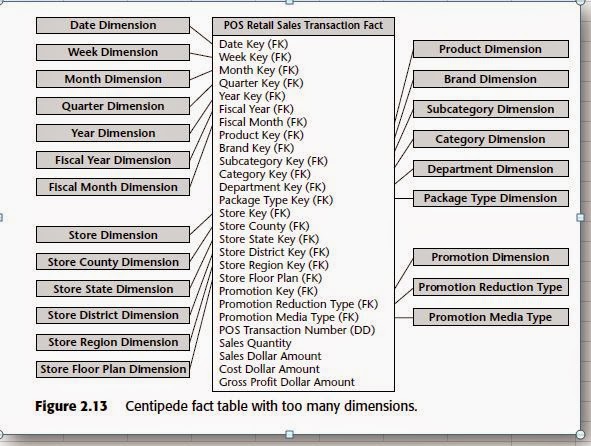
Most business processes can be represented with less than 15 dimensions in
the fact table. If our design has 25 or more dimensions, we should look for
ways to combine correlated dimensions into a single dimension. Perfectly correlated
attributes, such as the levels of a hierarchy, as well as attributes with a
reasonable statistical correlation, should be part of the same dimension. You
have made a good decision to combine dimensions when the resulting new
single dimension is noticeably smaller than the Cartesian product of the separate
dimensions.

No comments:
Post a Comment